
Which MLB Team Truly Had the Worst Season?
Different measures name different modern-era teams: the 2024 White Sox for losses and the 1916 Athletics for lowest winning percentage.
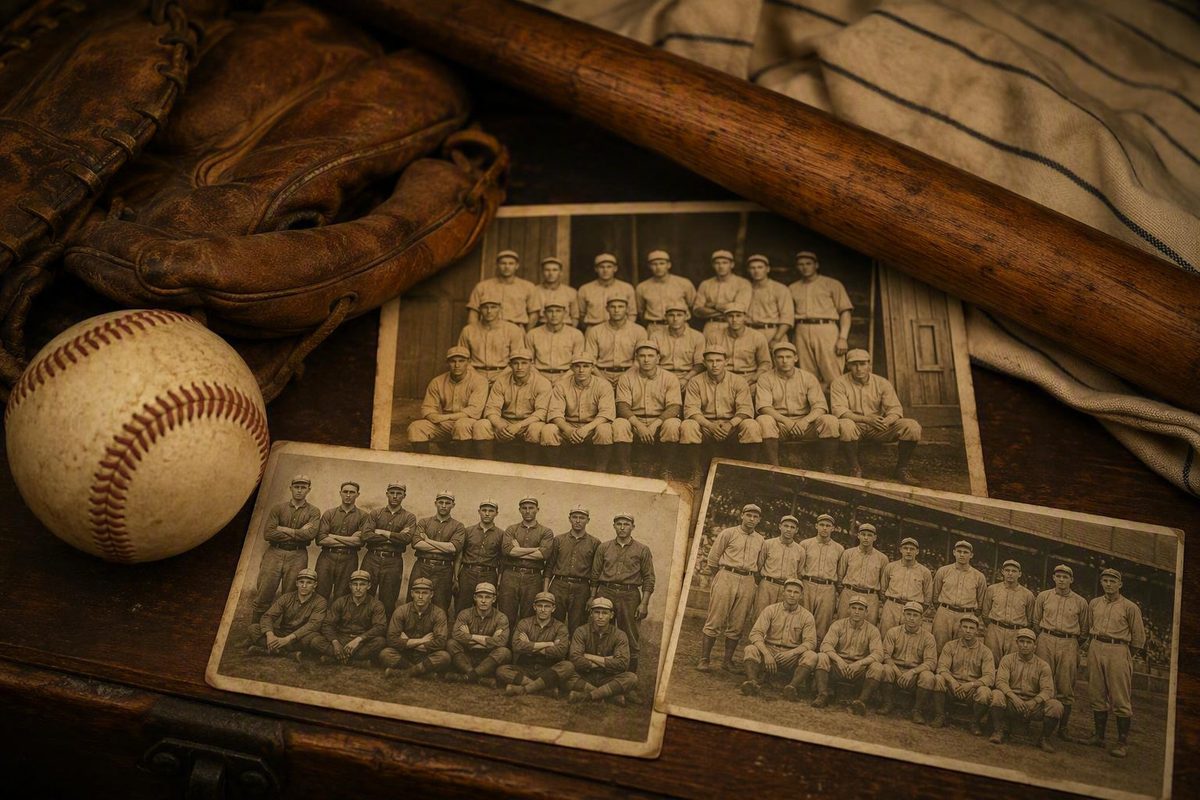
The 1899 Cleveland Spiders are the standard answer to the question of the worst baseball record ever. They finished 20–134, a .130 winning percentage, over a 154-game National League schedule—a record documented by the Society for American Baseball Research.
That answer applies when “worst” means the lowest winning percentage among major-league teams that played a substantial schedule. Different measures produce different modern-era answers: the 2024 Chicago White Sox hold the post-1900 record for losses, while the 1916 Philadelphia Athletics have the lowest modern-era winning percentage.
The short answer: the 1899 Cleveland Spiders
Cleveland won only 20 of its 154 games in 1899. That works out to a .130 winning percentage, or roughly one victory for every eight games played. No other recognized major-league team meeting the commonly used substantial-schedule threshold has finished with a lower percentage.
The scope matters. This comparison concerns major-league regular seasons, not every minor-league, independent, Negro League, college, amateur or international team. The available evidence does not establish one universal “worst baseball team” across every level and competition.
Cleveland’s line below is the SABR-documented record cited above; the modern-era records are reported in MLB’s ranking of single-season loss leaders.
| Team | Record | Winning percentage | Category |
|---|---|---|---|
| 1899 Cleveland Spiders | 20–134 | .130 | Worst all-time percentage under a substantial-schedule standard |
| 1916 Philadelphia Athletics | 36–117 | .235 | Lowest modern-era percentage |
| 1962 New York Mets | 40–120 | .250 | Former modern-era loss leader |
| 2024 Chicago White Sox | 41–121 | .253 | Most losses since 1900 |
The White Sox percentage can be checked directly from the final record: 41 wins divided by 162 games equals .253 when rounded to three decimal places. Chicago therefore accumulated more losses than any other post-1900 club, but it did not finish with the modern era’s lowest winning percentage.
That distinction is central to the answer. Cleveland owns the strongest all-time claim under a substantial-schedule standard; Philadelphia owns the modern percentage low; Chicago owns the post-1900 loss total.
Why “worst” has more than one correct category
A team can reach the bottom of the record book in more than one way. The latter is usually more useful when comparing seasons of different lengths.
A team playing 162 games has eight more opportunities to lose than a team playing 154. Early professional clubs sometimes played far fewer games than either. Without a minimum schedule, a short and disastrous season can produce a more extreme percentage than a full-season collapse while representing a much smaller body of games.
The historical compilation used for this comparison sets a minimum of 120 games for its principal list. Under that convention, Cleveland’s 20–134 record ranks last. The same compilation of historically poor major-league records lists the 1875 Brooklyn Atlantics at 2–42, a .045 percentage, but that club played only 44 games in the National Association. The National Association’s status as a major league is also disputed.
That does not erase the Atlantics’ record. It explains why the result is not normally treated as a straightforward answer to the MLB question. League classification and schedule length are part of the definition, not technicalities to be ignored after the numbers are compared.
There is a similar wrinkle around the term “modern era.” MLB’s loss ranking defines it as beginning in 1900, while the substantial-schedule compilation uses 1901. The one-year difference does not change the category leaders discussed here: the Athletics still have the lowest modern-era percentage, and the White Sox still have the highest modern-era loss total.
Labels such as “worst team ever” or “most hopeless team” are historical judgments rather than official statistical categories. A defensible answer must first specify the league, schedule threshold, era and metric.
How shared ownership dismantled the Spiders
The Spiders were not merely a weak roster enduring an ordinary downturn. Cleveland had been competitive earlier in the 1890s and employed leading players including Cy Young, Jesse Burkett and Bobby Wallace.
The collapse followed an ownership arrangement known as syndicate ownership. Cleveland owner Frank Robison also gained control of the National League club in St. Louis. Leading players were then shifted from Cleveland to St. Louis, leaving the Spiders with a severely depleted roster. SABR’s history of the organizational destruction behind the 1899 season identifies Young, Burkett and Wallace among the prominent players moved to St. Louis.
That context separates the Spiders from a club that simply drafted poorly, suffered injuries or reached the end of a competitive cycle. Cleveland had fielded a strong team before its roster was stripped for the benefit of another club controlled by the same ownership interests.
The final record was accompanied by prolonged stretches of failure. The Spiders lost 24 consecutive games, endured six separate losing streaks of at least 10 games, and lost 40 of 41 during one stretch. Those figures do not replace the full-season record as the deciding measure, but they show that the .130 percentage was not created by one isolated slump.
Cleveland also played an exceptionally road-heavy schedule. Historical sources disagree on the precise road record, so assigning a definitive away split would create false certainty. The supported conclusion is the broader one: the Spiders spent an extraordinary portion of the season away from home while competing with a roster weakened by transfers.
Their .130 percentage therefore records both on-field failure and a breakdown in competitive integrity permitted by the structure of 19th-century baseball. The statistic belongs in the major-league record book, but the circumstances behind it differ sharply from those surrounding modern rebuilding teams.
The worst records of the modern era
Since 1900, the answer again depends on whether the measure is losses or winning percentage.
The 2024 Chicago White Sox finished 41–121, setting the period’s single-season loss record. The 1916 Philadelphia Athletics went 36–117, producing the lower winning percentage of .235. Between them stand the 1962 New York Mets, whose 40–120 record and .250 percentage made them the modern loss leaders for more than six decades.
The Mets lost one fewer game than Chicago but posted a slightly worse percentage because they completed 160 games rather than 162. This is a compact example of why loss totals and winning percentages can point to different teams.
Chicago’s season also included a 21-game losing streak, which tied the American League record cited in MLB’s account of the modern loss leaders. The streak supplies useful context, but it is not what gave the White Sox the season-loss record. A streak measures one continuous part of a schedule; a final record accounts for every game.
The comparison with Cleveland is much more dramatic than the raw totals initially suggest:
- Chicago won approximately one of every four games, finishing at .253.
- Cleveland won approximately one of every eight, finishing at .130.
- Chicago played eight more games but still lost 13 fewer than Cleveland.
A loss-only comparison consequently understates how far the Spiders sat below even the weakest modern clubs. Chicago reached the post-1900 extreme for losses, yet Cleveland’s winning rate was barely more than half of Chicago’s.
Philadelphia presents the opposite lesson. The 1916 Athletics lost fewer games than either the Mets or White Sox, but their shorter schedule and 36-win total left them with the lowest winning percentage among the cited modern-era teams.
A fair way to compare baseball’s worst seasons
The most responsible comparison begins with the records the teams actually compiled. Cleveland went 20–134, Philadelphia went 36–117, New York went 40–120 and Chicago went 41–121. Winning percentage then places those records on a common mathematical scale without pretending that every season had the same length.
A projection can make the difference easier to visualize:
Hypothetical projection: Applying Cleveland’s .130 winning percentage to a 162-game schedule produces approximately a 21–141 record.
The Spiders did not finish 21–141, and they did not play 162 games. That projection merely translates their winning rate to the length of a current schedule; the same approximate conversion is included in the historical substantial-schedule comparison.
Even percentage-based normalization has limits. It cannot eliminate differences in league structure, ownership rules, roster construction, travel, scheduling or competitive conditions. Two clubs can have mathematically comparable records without having failed in comparable baseball environments.
The fairest answer is therefore categorical. The 1899 Cleveland Spiders are the strongest standard choice for the worst substantial major-league season, finishing 20–134 with a .130 winning percentage. The 1916 Philadelphia Athletics retain the lowest modern-era percentage at .235, while the 2024 Chicago White Sox hold the post-1900 loss record with 121.
Cleveland’s mark stands apart not only because of how few games the Spiders won, but because the record captured an ownership system capable of dismantling one club to strengthen another. It remains an unmatched statistical collapse produced by a version of major-league baseball profoundly different from the modern game.