
The Best NL Pennant-Winning Records—and Why 1969 Changed the Question
The 1906 Cubs lead at 116-36 (.763); the 1975 Reds and 1986 Mets share the Championship Series-era mark at 108-54.
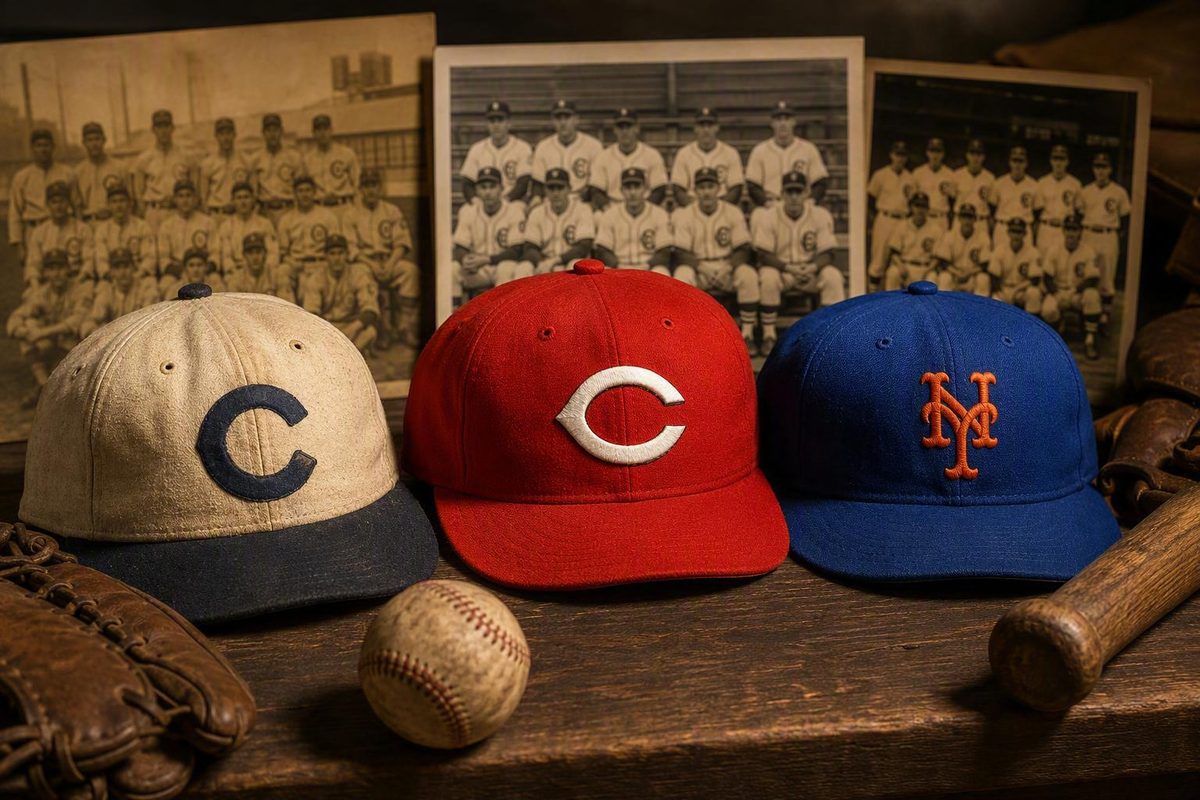
For the National League, the 1906 Chicago Cubs have the leading pennant-winning regular-season record: 116-36 in 152 games, a .763 winning percentage. The strongest record in the NL’s Championship Series era is 108-54 (.667), shared by the 1975 Cincinnati Reds and 1986 New York Mets, according to a third-party compilation of National League pennant winners.
Those are National League benchmarks, not a definitive answer for all of Major League Baseball. An MLB-wide conclusion would also require a comparable review of American League pennant winners.
Related: The Oldest Records in Baseball’s Book.
The direct answer: the 1906 Cubs hold the evidenced NL mark
The Cubs’ 1906 season stands above the other listed NL pennant-winning records by winning percentage. Chicago also finished 20 games ahead of the New York Giants, according to the same third-party compilation.
The historical format is important. In 1906, the regular-season leader received the National League pennant directly. The Cubs did not have to advance through a separate league playoff to become NL champions.
That makes their record different in meaning from the record of a modern pennant winner. Chicago’s regular-season performance both established its place in the standings and secured the league championship. Since 1969, an NL team’s regular-season record has instead determined its postseason position; the pennant itself has been decided in postseason competition.
The available comparison remains NL-specific. It does not identify the American League record holder and therefore cannot establish which pennant winner had the best regular season across both major leagues.
Record table: the leading NL pennant seasons in the evidence
The NL pennant-winner compilation attributes the following records and results to the three highlighted clubs:
| Season and team | Regular-season record | Winning percentage | Pennant route; World Series result |
|---|---|---|---|
| 1906 Chicago Cubs | 116-36 in 152 games | .763 | Regular-season standings; — |
| 1975 Cincinnati Reds | 108-54 in 162 games | .667 | Championship Series era; won World Series |
| 1986 New York Mets | 108-54 in 162 games | .667 | Championship Series era; won World Series |
The Cubs hold the leading percentage among the listed NL pennant winners. The Reds and Mets share the corresponding benchmark for NL pennant winners in the Championship Series era, and both subsequently won the World Series.
The different schedule lengths also show why raw wins cannot settle the comparison. Chicago played 10 fewer games than Cincinnati and New York. Winning percentage accounts for that difference by measuring the share of decisions each team won.
Why pennant history divides at 1969
A pennant denotes a league championship, but the National League has not always used the same method to determine its champion.
From 1876 through 1968, the NL pennant went to the club with the best regular-season record. Finishing first and winning the league championship were therefore part of the same accomplishment.
That system changed in 1969, when the NL introduced East and West divisions and their winners met in a postseason series. MLB identifies 1969 as the first League Championship Series season and names Baltimore and New York as the inaugural league-series winners on its official postseason history page.
| Period | How the NL pennant was determined |
|---|---|
| 1876 through 1968 | Best regular-season record |
| 1969 onward | Postseason competition |
The dividing line changes what a pennant-winning record represents. Before divisional play, the record directly earned the NL championship. In the postseason era, the record describes how a future pennant winner performed before entering the competition that decided the league title.
That distinction does not diminish either kind of achievement. It simply prevents unlike accomplishments from being treated as though they occurred under one continuous championship format.
Best record, pennant, and World Series berth are not interchangeable
A best regular-season record measures performance across the scheduled season. A pennant is the league championship under the rules and format in effect at the time.
Through 1968 in the National League, those concepts aligned because the regular-season leader received the pennant. Beginning in 1969, they separated: an NL club could finish with the league’s strongest regular-season record and still fail to win the pennant if it lost in postseason competition.
The distinction also clarifies the ambiguity in calling a club the “best team.” The phrase may refer to the team with the best record over the full regular season, or it may refer to the team that won the postseason tournament and became league champion. Since 1969, those descriptions can apply to different teams.
A poster in a Reddit community discussion proposed separating the honors differently: award the pennant to the regular-season record leader while retaining the League Championship Series as the qualifier for the World Series. That is one fan’s preferred system, not an official rule, a historical consensus or evidence of widespread support.
Applying such a proposal retrospectively would require more than identifying each season’s raw win leader. Without that work, claims about which historical pennants would change hands would be speculative.
How to compare pennant-winning records fairly across eras
Winning percentage is the most useful starting point when teams played schedules of different lengths:
Winning percentage = wins ÷ total decisions
Using the records attributed in the table, the 1906 calculation is:
116 ÷ (116 + 36) = 116 ÷ 152 ≈ .763
For both the 1975 Reds and 1986 Mets, it is:
108 ÷ (108 + 54) = 108 ÷ 162 = .667
Raw wins alone would conceal the difference between a 152-game schedule and a 162-game schedule. Winning percentage does not eliminate every cross-era problem, but it provides a common measure of how frequently each team won.
Record quality must also be separated from margin of victory. The 1902 Pittsburgh Pirates finished with a 27.5-game lead, the largest margin attributed to a pre-divisional NL pennant winner in the compilation. That does not make Pittsburgh the winning-percentage leader. One statistic measures how often a club won; the other measures how far it finished ahead of its contemporary competition.
Postseason structure adds another layer. The NLCS changed from best-of-five to best-of-seven for the 1985 postseason. Consequently, the 1975 Reds and 1986 Mets shared the same regular-season record but did not face identical league-championship formats.
The 1994 season is an exception rather than a normal entry in a pennant comparison. A players’ strike canceled the postseason, and no pennant was awarded.
With those qualifications, the NL findings are clear: the 1906 Cubs set the listed league benchmark at 116-36 and .763, while the 1975 Reds and 1986 Mets share the Championship Series-era mark at 108-54 and .667. The central historical break is 1969, when a pennant-winning record stopped being the performance that automatically secured the NL championship and became the regular-season résumé of a club that still had to win in the postseason.